Pipelines and Pathways Key Metrics to Measure
-
Number and percent of UVA employees and earning wages at or above different income levels relative to a threshold.
-
Number and percent of the community earning wages above at different income levels relative to a threshold.
Pipelines and Pathways Community Metrics
The President's Council on UVA-Community Partnerships know that the community wants to know what steps are being made following the Pipelines and Pathways Committee recommendations and if they are making a difference! This page is the beginning, not the end! It shows where the University and the community are starting so that progress can be measured.
Please watch the video to learn more about how to use the information on this page.
Income and Demographic Data for UVA Employees and Full-Time Workers Who Live in the Region
The charts on this page display demographic and income data for full-time workers who live in the Charlottesville region. Full-time workers are defined as those working 35 hours or more per week. The Charlottesville region includes the following localities: Charlottesville City, Albemarle, Fluvanna, Nelson, Greene, and Louisa.
Regional Workers Employed by UVA
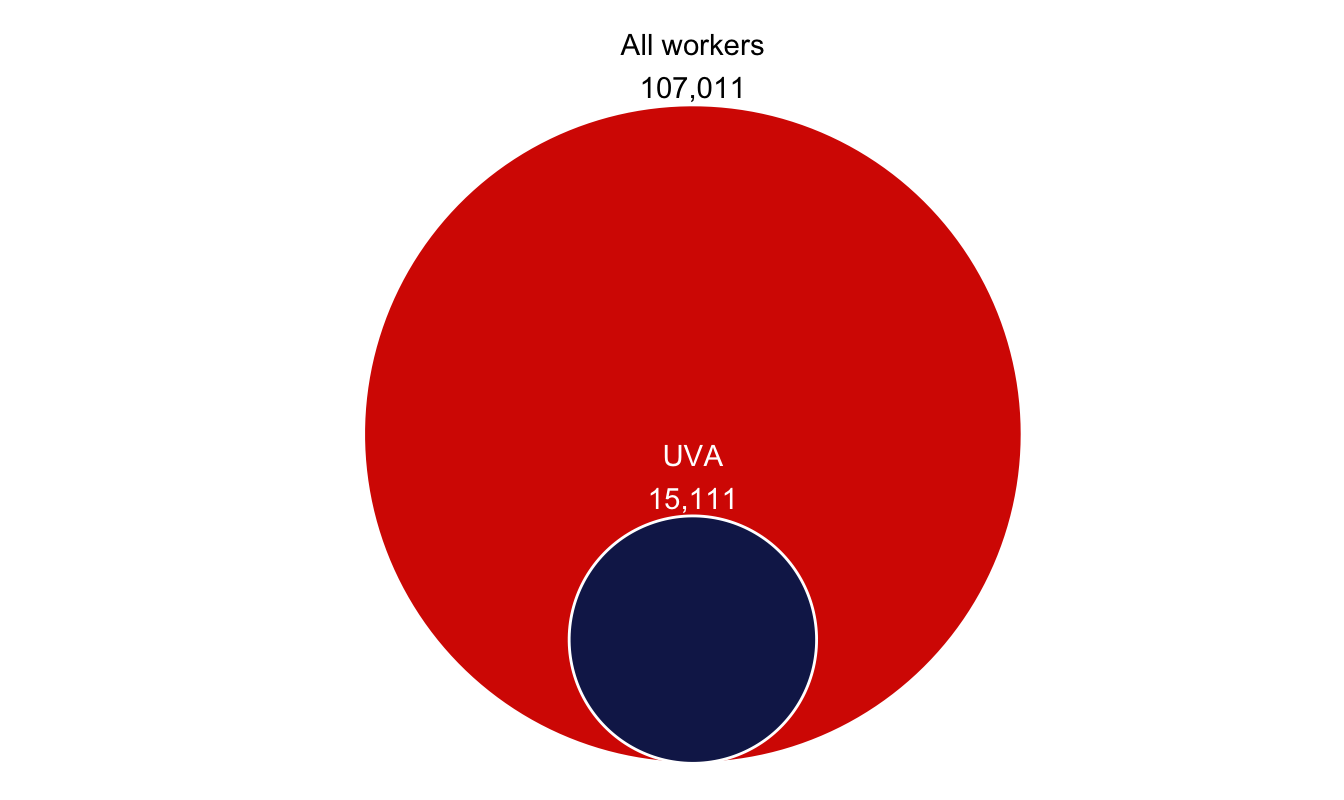
The following charts show the proportion of workers in the community who are employed by UVA. The red circles and associated values represent workers in the region and the blue circles and associated values represent local UVA employees.
All workers
There are an estimated total of 107,011 full-time working adults in the Charlottesville region, with a total of 15,111 employed by UVA. About 14% of all full-time, local workers are employed by UVA.
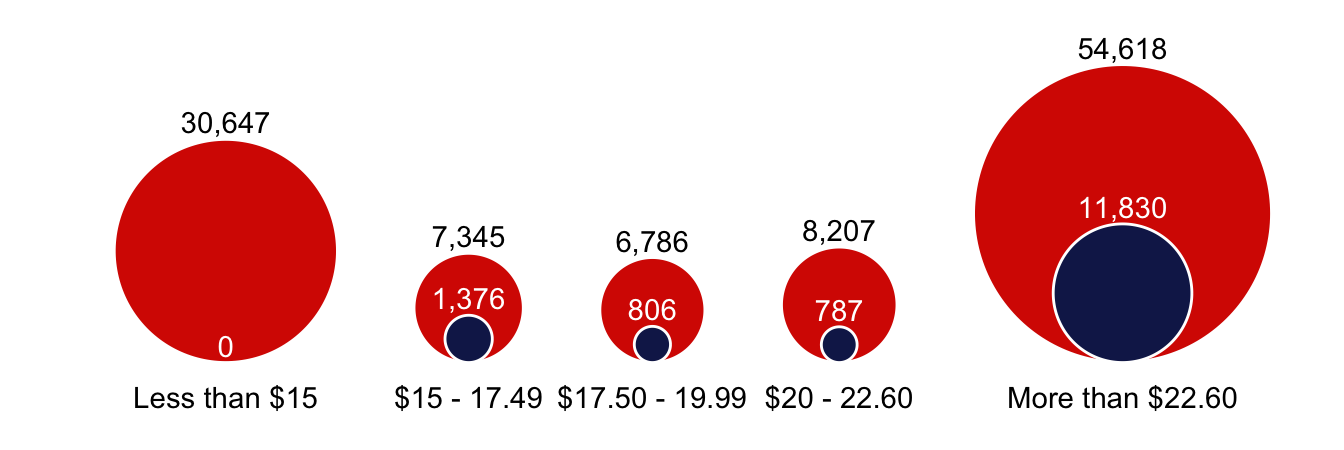
By Income
The chart below shows the number of community workers who are employed by UVA separated into income ranges, shown here as hourly wages. The University instituted a $15 minimum wage in 2019, shown below with no UVA employees in the category making less than $15 an hour.
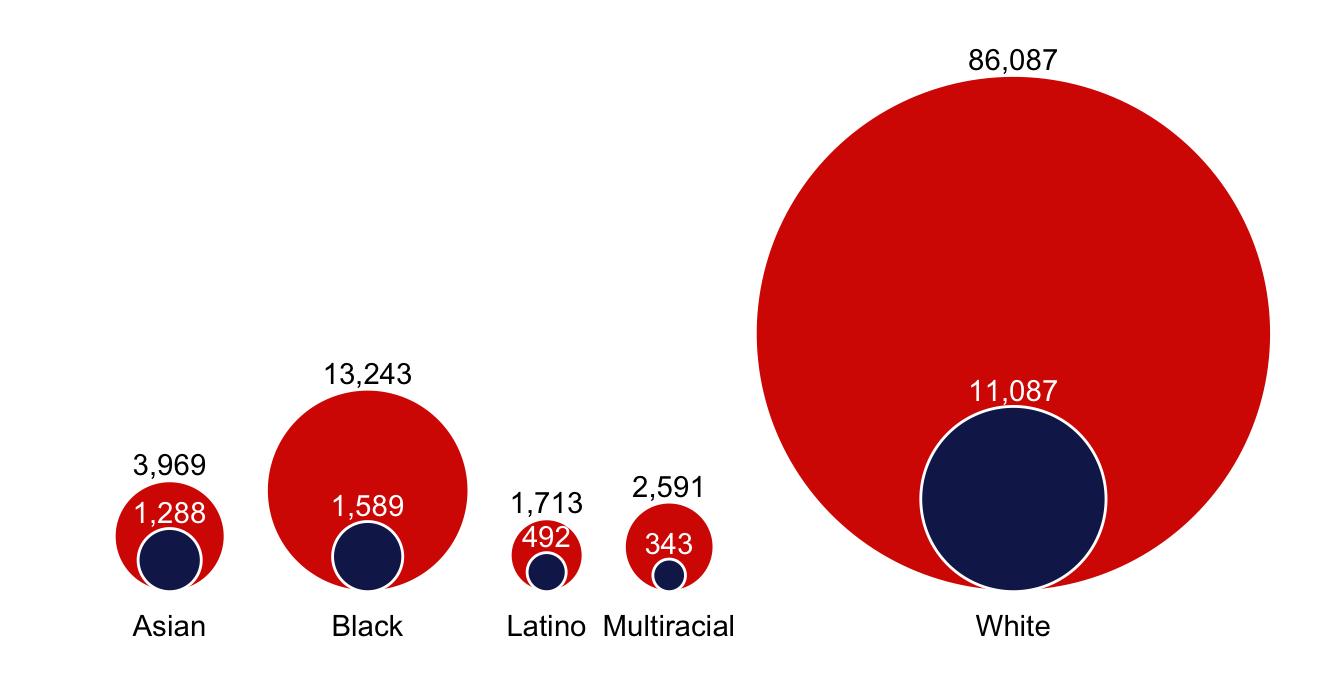
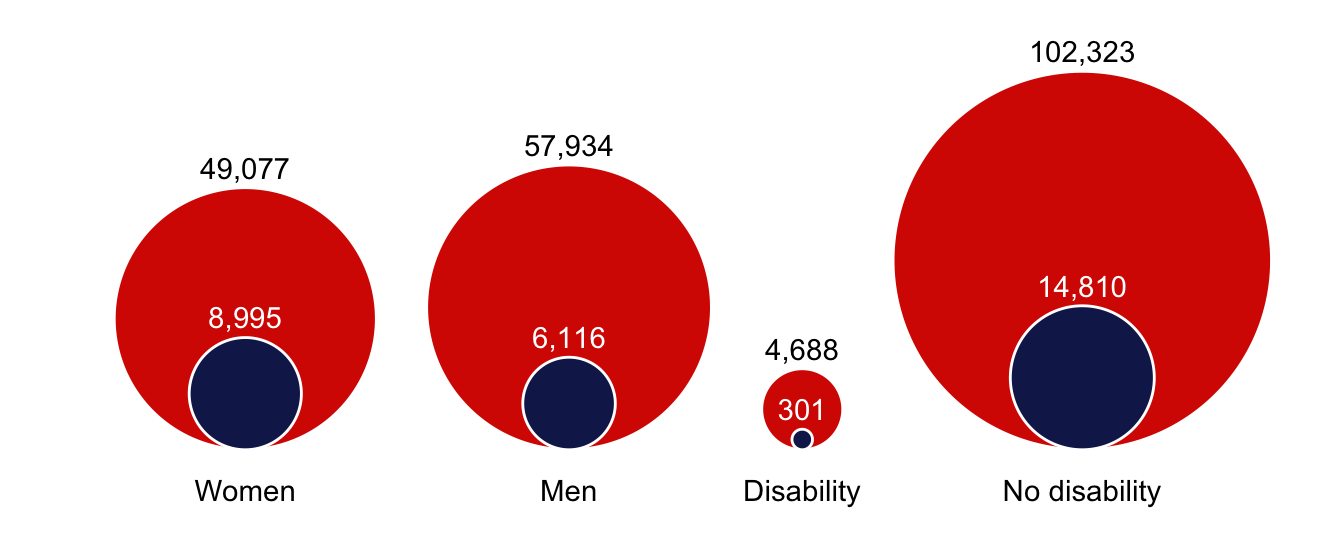
By Demographic Categories
The following two charts show the number of community workers employed by UVA, separated into self-reported demographic categories.
UVA and Regional Worker Income and Demographic Data
The graphs below show income and demographic data for UVA and community workers who live in the region and work 35 or more hours a week. This section includes tabs to compare community workers with (1) All UVA employees, (2) UVA Academic Division employees, and (3) UVA Medical Center employees. As of December 31, 2021, a total of 15,111 people were employed by UVA and living in the region, with 9,003 employed by UVA’s Academic Division and 6,108 employed by the UVA Medical Center. Hover over the data points to see the number of employees represented in each percentage.
- No UVA employees make less than $15 because UVA instituted a $15/hour minimum wage in 2019.
- UVA demographic data is self-reported; percentages in some graphs don’t add to 100% because
- a) some employees did not disclose their demographic information and
- b) some racial groups were excluded to protect the anonymity of individuals in groups with small numbers.
UVA and Regional Worker Demographics by Income Band
The following graphs show the percent of each demographic group that is within a pay range across UVA and the community. See each tab to compare community workers with (1) All UVA employees, (2) UVA Academic Division employees, and (3) UVA Medical Center employees.
Employment data for the University was provided by University of Virginia Human Resources, and it reflects University employment as of December 31st, 2021. Community data was retrieved from the Public Use Microdata of the American Community Survey conducted by the U.S. Census Bureau, and includes the 2016-2020 five-year estimates. All demographic data is self-reported, based on selection options provided by UVA HR and the U.S. Census Bureau.
This summary was produced by the UVA Equity Center Democratization of Data team. For more information on these data sources and our process, please see our Data Notes.
| Pipelines and Pathways Metrics | ||||||||||||||||||||||||||||||||||||||||||||||||||||||||||||||||||||||||||||||
|---|---|---|---|---|---|---|---|---|---|---|---|---|---|---|---|---|---|---|---|---|---|---|---|---|---|---|---|---|---|---|---|---|---|---|---|---|---|---|---|---|---|---|---|---|---|---|---|---|---|---|---|---|---|---|---|---|---|---|---|---|---|---|---|---|---|---|---|---|---|---|---|---|---|---|---|---|---|---|
|